FB Style Menu

Saturday, July 2, 2022

Why Standard Deviation value defer from Numpy and Excel !!!

If you import numpy and find standard deviation value for 32,24,67,45,59,77,97, you will get below result.


import numpy

array = [32,24,67,45,59,77,97]

std = numpy.std(array)

print(std)

OUTPUT : 23.7890


The same array you put into excel worksheet and use excel formula (STDEV(A1:A7))

OUTPUT : 25.6951


What is the difference?

The difference is numpy std( ) function is calculated for Population data while excel STDEV formula is calculated for Sample data.


If we want to calculated Sample SD in python, we need to import "statistics" instead of "numpy", then used stdev( ) function. 

import statistics 

array = [32,24,67,45,59,77,97]

x = statistics.std(array)

print(x) 

OUTPUT :

25.695098661770018

23.78903880670547


Take away : 

If you need to calculate SD for Population data, use numpy.

If you need to calculate SD for Sample data, use statistics.


Saturday, February 26, 2022

Data Virtualization - Pie Chart

# Importing pandas and matplotlib

import pandas as pd

from  matplotlib import pyplot as plt 


# Read excel

Mydata7 = pd.read_excel('D:\\DATA SCIENCE Learning 2021\\DATA VIZ Python Basic\\file7.xlsx')

Mydata7


# Creating simple Pie Chart

mycolors = ["#E3CF57", "#66CDAA", "#CD3333", "#6495ED","blue","green"] 

# For color code, you can reference from  https://planetnz.blogspot.com/2022/02/color-code-in-ascii.html

plt.pie(Mydata7[2021], labels = Mydata7['City Population'], colors=mycolors,

        startangle=90, shadow = True, explode = (0, 0, 0.1, 0,0,0),

        radius = 1.3, autopct = '%1.1f%%')                    


#add the labels     

plt.title("City Population of 2021",fontsize = 18,pad = 14)     


# plotting legend

plt.legend(bbox_to_anchor = (1.2, 1))


# showing the plot

plt.show()


Source data table :

City Population

2019

2020

2021

Yangon

300,000

312,000

350,000

Mandalay

270,000

290,000

310,000

Sagaing

160,000

170,000

190,000

MonYwar

180,000

190,000

210,000

Harkhar

90,000

100,000

110,000

Loikaw

140,000

150,000

160,000


Reference Websites :

https://matplotlib.org/stable/api/_as_gen/matplotlib.axes.Axes.pie.html?highlight=pie#matplotlib.axes.Axes.pie

https://www.w3schools.com/python/matplotlib_pie_charts.asp

Thursday, February 24, 2022

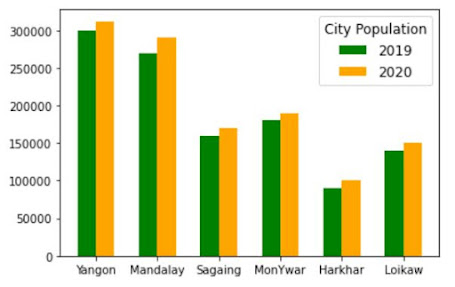
Data Virtualization by Python - Group Bar Charts

 # Importing pandas, numpy and matplotlib

import pandas as pd

import numpy as np

from  matplotlib import pyplot as plt


# Importing excel

Mydata7 = pd.read_excel('D:\\file path\\file name.xlsx')

Mydata7


# Creating group bar chars (two bars)

fig, ax = plt.subplots(1,1, figsize = (8,6))

nnnz = Mydata7 ['City Population']

x = np.arange (len(nnnz))


#set a width for each bar 

width = 0.3

A = ax.bar(x - width/2 , Mydata7[2019], width, label='2019',color='green')

B = ax.bar(x + width/2 , Mydata7[2020], width, label='2020',color= 'orange')


#set the ticks (This show site name in x axis)

ax.set_xticks(x)

ax.set_xticklabels(nnnz)


#add the legend       #using the labels of the bars

ax.legend (title = "City Population",fontsize = 10,title_fontsize = 12)


#--------------------------------------------------------------------------

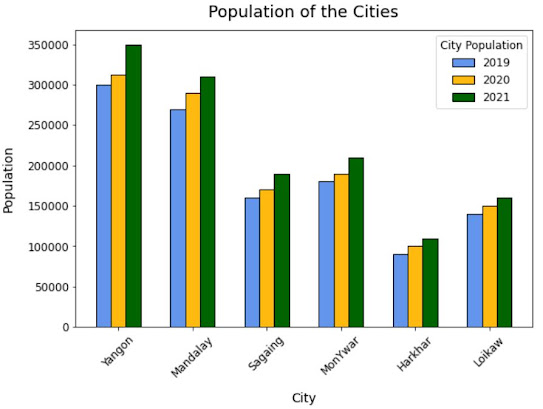
# Creating grouped bar charts (3 bars)

#create the base axis

fig, ax = plt.subplots(1,1, figsize = (9,6))


#set the label   #and the x positions

label = Mydata7 ["City Population"]

x = np.arange(len(label))


#set the width of the bars

width = 0.2


#create the first bar -1 width

rect1 = ax.bar (x - width, Mydata7 [2019],  width = width, label = 2019, edgecolor = "black", color ='#6495ED')   

#create the second bar using x

rect2 = ax.bar (x , Mydata7 [2020] , width = width , label = 2020 , edgecolor = "black", color= '#FFB90F')

#create the third bar plus 1 width

rect3 = ax.bar (x + width ,  Mydata7 [2021] , width = width , label = 2021 , edgecolor = "black", color='#006400')


#add the labels to the axis

ax.set_ylabel ("Population", fontsize = 14, labelpad = 12)          

ax.set_xlabel ("City", fontsize = 14, labelpad =12)      

ax.set_title("Population of the Cities",fontsize = 18,pad = 12)            


#set the ticks      #using the labels

ax.set_xticks(x)

ax.set_xticklabels(label)


#add the legend

ax.legend(title = "City Population", fontsize = 12,title_fontsize = 12,bbox_to_anchor = (1.0, 1)) 


#adjust the tick paramaters         

ax.tick_params(axis = "x",which = "both",labelrotation = 45,labelsize = 12)   

ax.tick_params(axis = "y",which = "both",labelsize = 12)


#----------------------------------------------

# Adding text label in each bar

# This code need to put below after creating bar charts

for bar in ax.patches:

  # The text annotation for each bar should be its height.

  bar_value = bar.get_height()

  # Format the text with commas to separate thousands. You can do

  # any type of formatting here though.

  text = f'{bar_value:,}'

  # This will give the middle of each bar on the x-axis.

  text_x = bar.get_x() + bar.get_width() / 2

  # get_y() is where the bar starts so we add the height to it.

  text_y = bar.get_y() + bar_value

  # If we want the text to be the same color as the bar, we can

  # get the color like so:

  bar_color = bar.get_facecolor()

  # If you want a consistent color, you can just set it as a constant, e.g. #222222

  ax.text (text_x, text_y, text, ha='center', va='bottom', color=bar_color, size=10)


Source data table :

City Population

2019

2020

2021

Yangon

300,000

312,000

350,000

Mandalay

270,000

290,000

310,000

Sagaing

160,000

170,000

190,000

MonYwar

180,000

190,000

210,000

Harkhar

90,000

100,000

110,000

Loikaw

140,000

150,000

160,000


Reference Websites :
https://towardsdatascience.com/easy-grouped-bar-charts-in-python-b6161cdd563d
https://www.pythoncharts.com/matplotlib/grouped-bar-charts-matplotlib/

Data Virtualization by Python - Bar Chart Simple

# Importing pandas and matplotlib

import pandas as pd

import numpy as np

from  matplotlib import pyplot as plt 


# Importing excel table

Mydata = pd.read_excel('D:\\file path\\file name .xlsx')

Mydata


# Note : Python adding it's own index automatically when we read excel. (red circle highlighted)


# Creating simple bar graph

# plt.bar(Mydata ['column name for x axis '],height=Mydata7[ 'column name for y bar'])

plt.bar ( Mydata7 ['City Population'] ,  height = Mydata7 [2019] )


# If we set 'City Population' as index column

Mydata = Mydata.set_index('City Population')

Mydata


# Then, instead of writing 'column name for x axis' , we can use '.index' as x asix

plt.bar (Mydata.index ,  height = Mydata [2019] , color = 'green' )


Source Table

City Population

2019

2020

2021

Yangon

300,000

312,000

350,000

Mandalay

270,000

290,000

310,000

Sagaing

160,000

170,000

190,000

MonYwar

180,000

190,000

210,000

Harkhar

90,000

100,000

110,000

Loikaw

140,000

150,000

160,000


By NwayNz


Tuesday, February 15, 2022

Data Virtualization by Python - Line Chart

# Importing pandas and matplotlib
import pandas as pd
from matplotlib import pyplot as plt
from mpl_toolkits.axes_grid1 import host_subplot

# Import excel or csv
# You can copy and paste sample data in down there - > Table data
Mydata = pd.read_excel('D:\\file path\\file name.xlsx')
Mydata.head(2)


# Grouping data
Sumdata = Mydata.groupby('Region').sum()
Sumdata


# Line Chart one line
# Figure size setting
plt.figure(figsize=(6,5))

plt.plot(Mydata2.index, Mydata2['Data Traffic (MB)'],color ="#003A99")

plt.title("Attach User and Traffic",fontsize=16, fontweight="bold")
plt.xlabel('Attach User',fontsize=13)
plt.ylabel("Total traffic (MB)",fontsize = 13)

#Rotation label words
plt.xticks(rotation=45)

plt.show()


-----------------------------------------------------------------------------------------------
# Line Chart two lines
from  matplotlib import pyplot as plt
plt.plot(Mydata2.index, Mydata2['Attach User'],label = "User",color ="Red")
plt.plot(Mydata2.index, Mydata2['Data Traffic (MB)'],label = "Traffic",color ="Green")

plt.title("Attach User and Traffic",fontsize=14, fontweight="bold")
plt.xlabel('Region',fontsize=13)
plt.ylabel("Total traffic (MB)",fontsize = 13)

# show a legend on the plot
plt.legend()

plt.show()


----------------------------------------------------------------------------------------------

# Labeling on both Y axes
Graph,A = plt.subplots()
Graph.set_size_inches(8, 4, forward=True)

A.plot(Mydata2.index,Mydata2['Attach User'],marker="+",label='User',color="Green")
A.set_xlabel("Region")
A.set_ylabel("Attach User")

B=A.twinx()
B.plot(Mydata2.index,Mydata2['Data Traffic (MB)'],marker="o",label='Traffic',color="blue")
B.set_ylabel("Traffic(MB)")

plt.title('Traffic and User per site')
Graph.legend()

#Rotation x label words
#below two lines of code got warning
#xlabels = Mydata['Site Name']
#A.set_xticklabels(xlabels, rotation=45)
#A.set_xticks(rotation=45)

plt.show()


--------------------------------------------------------------------------------

Table data :

Region

Site Name

Date

Attach User

Data Traffic (MB)

Technology

Yangon

YGN001

23-09-2021

79

2995

4G

Yangon

YGN002

23-09-2021

126

5450

4G

Yangon

YGN003

23-09-2021

260

16710

4G

Mandalay

MDY001

23-09-2021

163

8768

4G

Mandalay

MDY002

23-09-2021

7

0

4G

Mandalay

MDY003

23-09-2021

223

13154

4G

NayPyiTaw

NPT001

23-09-2021

236

9250

3G

NayPyiTaw

NPT002

23-09-2021

172

5739

4G

NayPyiTaw

NPT003

23-09-2021

318

7265

4G

Shan

SHAN001

23-09-2021

195

6590

3G

Shan

SHAN002

23-09-2021

205

2948

4G

Mon

MON001

23-09-2021

31

2156

3G

Mon

MON002

23-09-2021

138

4743

4G

Ayarwaddy

AYA001

23-09-2021

63

1576

3G

Ayarwaddy

AYA002

23-09-2021

145

3245

4G


Reference :
https://cmdlinetips.com/2019/10/how-to-make-a-plot-with-two-different-y-axis-in-python-with-matplotlib/#:~:text=The%20way%20to%20make%20a,by%20updating%20the%20axis%20object.